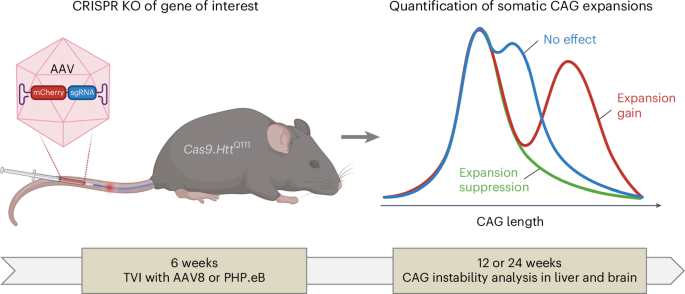
HttQ111 knock-in mice models have proven to be excellent systems in which to study HTT CAG expansion. We previously identified key modifiers of this process through genetic crosses with mice harboring null mutations11,12,13,14,15, whose relevance has been directly validated through human genome-wide association studies (GWAS)4,5,6,7,8. However, this approach is time-consuming, cost-inefficient and low-throughput. Repeat instability has been studied extensively in model systems such as bacteria, yeast and mammalian cell-based reporter assays10. Although much higher throughput, the disease-relevance of these observations (that is, relevance to in vivo instability in tissues) can be unclear. To bridge this gap, and with the goal of better understanding the factors and pathways that underlie somatic expansion, we have established an in vivo CRISPR–Cas9-based system for identifying somatic HTT CAG expansion-modifier genes by systemic delivery of adeno-associated virus (AAV) expressing single guide RNAs (sgRNAs) targeting genes of interest in Cas9-expressing HttQ111 knock-in mice16,17,18 (Fig. 1, Extended Data Fig. 1 and Supplementary Table 1). Taking advantage of efficient AAV8 delivery to liver19 and the high rate of expansion in liver paralleling that in disease-vulnerable striatum (Extended Data Fig. 2)9,18, we established a relatively high throughput screening platform that provides a sensitive readout of CAG expansion, eliminating the need for genetic crosses with constitutive null alleles and overcoming limitations of embryonic lethality.
Adeno-associated virus (AAV8 or PHP.eB) expressing mCherry and a sgRNA targeting a gene of interest is administered to HttQ111 mice, which constitutively express Cas9. Tail vein injections (TVI) are performed at 6 weeks of age and mice are aged to 12 weeks or 24 weeks for determination of Htt CAG repeat expansion in the liver or striatum. The blue line depicts a typical profile of CAG repeat lengths in untreated mice that would be observed if there was no effect of the sgRNA, and the green and red lines depict hypothetical CAG length profiles induced by sgRNAs that suppress or promote repeat expansion, respectively. The AAV vector is shown in more detail in Extended Data Fig. 1. KO, knockout.
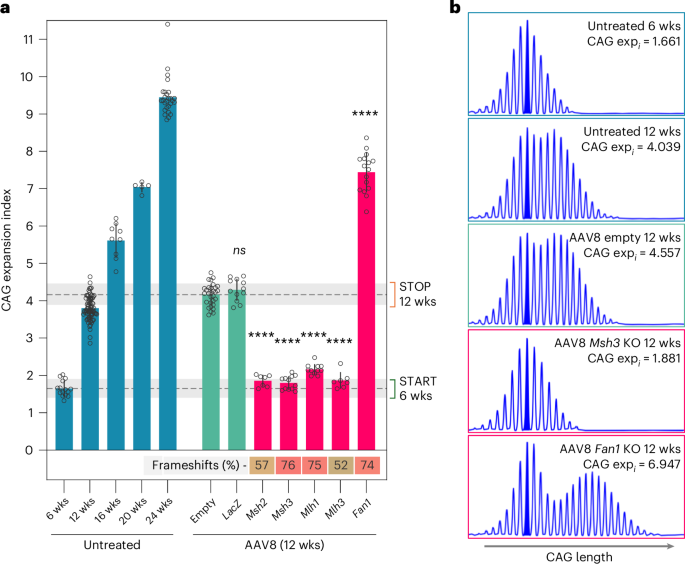
To validate this system, we targeted known strong modifiers of HttQ111 CAG expansion, namely mismatch repair (MMR) genes Msh2, Msh3, Mlh1 and Mlh3 (enhancers) and Fan1 (suppressor)11,12,13,14,15,20, achieving efficient viral transduction and editing (Extended Data Fig. 3 and Supplementary Tables 1 and 2). Targeting these MMR genes at 6 weeks suppressed expansion, producing a readout at 12 weeks comparable to 6-week-old mice, while targeting Fan1 enhanced expansions at 12 weeks beyond those in ~20-week mice (Fig. 2 and Supplementary Table 2). Control mice did not differ in CAG expansion within the range used (112–119) (Extended Data Fig. 4). Expansion suppression was comparable to that achieved by the respective constitutional homozygous knockout alleles11,12,13,14, indicating largely bi-allelic gene inactivation and was supported by immunoblot analyses (Extended Data Fig. 5). The impacts of CRISPR targeting were greater than anticipated by simulation based on mixing experiments with liver DNA (Extended Data Fig. 2), probably because of the relatively high editing efficiencies in hepatocytes compared to whole liver (Supplementary Table 2 and Extended Data Fig. 6)18 and potential underestimation of inactivating mutations; for example, large deletions and/or the functional impacts of non-frameshift mutations. Overall, we demonstrate highly efficient CRISPR–Cas9-mediated editing in liver, allowing the detection of both expansion suppressors and enhancers.
a, Somatic CAG expansion indices, determined from fragment sizing of Htt CAG repeat-containing PCR amplicons of untreated HttQ111 Cas9 mice livers from 6 to 24 weeks of age, and in 12-week-old mice injected at 6 weeks of age with control AAV8s (empty vector or expressing sgRNA targeting LacZ) or AAV8 expressing sgRNAs targeting genes in which null mutations are known to suppress (Msh2, Msh3, Mlh1, Mlh3)11,12,13,14 or enhance (Fan1)20 expansion. Transduction with empty AAV8 or a sgRNA targeting LacZ resulted in a slight background increase in expansion relative to 12-week-old untreated mice, and therefore effects of target sgRNAs are compared to the empty AAV8 vector control using a one-way ANOVA with Dunnett’s multiple comparison correction. Msh2, Msh3, Mlh1, Mlh3 and Fan1 relative to empty AAV8, ****P < 0.0001; ns, not significant. Bars show mean ± s.d. with overlaid individual data points. Dashed horizontal lines and shaded gray regions show mean and 95% confidence interval expansion indices in 6-week-old untreated mice (‘START’) and in empty AAV8 control-treated mice at 12 weeks of age (‘STOP’). The heatmap below shows the percent frameshift mutation (mean) for each targeted gene, with a green–yellow–red (0–100%) color scale. See Supplementary Table 2 for summary statistics, number of animals used (n) and P values. b, Examples of GeneMapper profiles of Htt CAG repeat PCR amplicons.
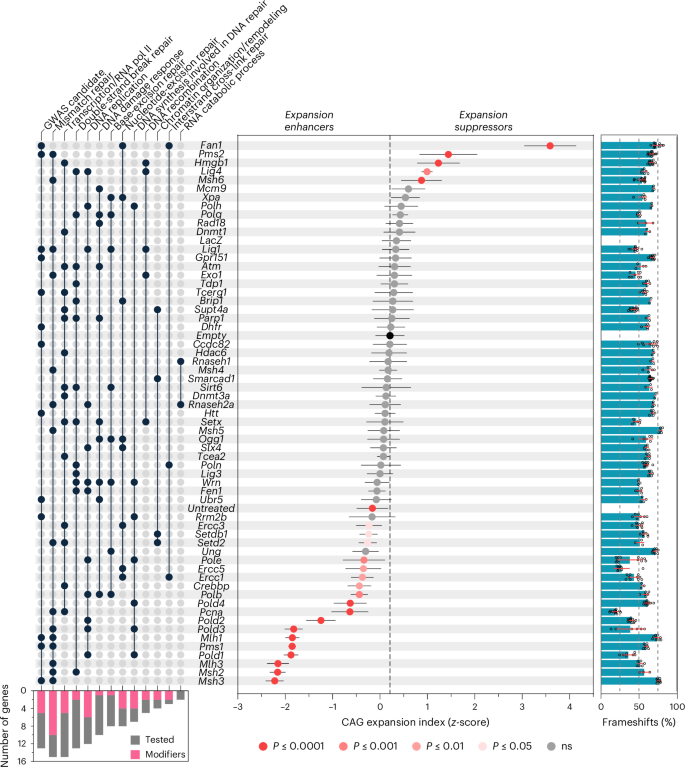
To gain new insight into the process of repeat expansion, we then targeted a large number of genes with previously unknown roles in HttQ111 CAG somatic expansion, including candidates from Huntington’s disease onset modifier GWAS6,7, DNA repair or DNA metabolism genes spanning different pathways, and genes implicated in repeat instability in various model systems10,21 (Fig. 3, Supplementary Tables 3 and 4). Targeting Pms1, Pold1 and Pold3 elicited expansion suppression comparable to targeting Msh2, Msh3, Mlh1 and Mlh3, whereas targeting Pold2, Pold4, Pole, Polb, Pcna, Crebbp, Ercc1, Ercc5, Ercc3, Setd2 and Setdb1 resulted in moderate to mild suppression (Fig. 3). Targeting Pms2, Msh6, Hmgb1 and Lig4 increased expansions, although to a lesser extent than Fan1 (Fig. 3). In silico off-target analyses of guides targeting modifier genes using Cas-OFFinder22 revealed high specificity for the respective target genes, with a requirement for at least a three nucleotide difference between a guide and any protein-coding off-target genomic location (Supplementary Table 5). Impacts on expansion suppression were not tied to precise editing efficiency, were consistent with loss of function and were broadly similar in hepatocytes and whole liver (Fig. 3, Extended Data Figs. 5 and 7 and Supplementary Table 2). The latter indicates that lower expansion indices were not caused by loss of expansion-harboring hepatocytes, with the exception of Pcna, whose targeting resulted in hepatocyte injury or loss and regeneration, precluding the interpretation of Pcna as a modifier in this system (Extended Data Fig. 8).
Ranked mean ± s.d. CAG expansion indices (as Z-scores) in livers from 12-week-old HttQ111 Cas9 mice treated at 6 weeks of age with AAV8 expressing sgRNA targeting candidate genes of interest and including empty vector, LacZ and untreated controls (see Supplementary Table 1 for sgRNA details). Adjusted P values were determined by one-way ANOVA with Dunnett’s multiple comparison test relative to empty vector (vertical dashed line). The bar graph on the right shows the percent frameshift mutation (mean ± s.d. with individual data points overlaid) for each targeted gene. See Supplementary Table 2 for summary statistics, number of animals used (n) and P values. The UpSet panel on the left (filled dot shows presence of the gene in the pathway; lines connect filled dots within a pathway to aid visualization) indicates candidate genes at genome-wide significant age at onset modifier loci (‘GWAS candidate’)7, followed by major Gene Ontology (GO) biological processes ranked in descending order of number of genes tested. To minimize redundancy, ‘transcription/regulation by RNA Polymerase II’ and ‘chromatin organization/remodeling’ are aggregated terms combined from standard GO terms. See Supplementary Table 3 for the full set of GO biological processes and Supplementary Table 4 for the rationale for gene inclusion. The bottom left bar graph indicates, for each pathway, the number of genes modifying expansion (adjusted P < 0.05) relative to the number of genes tested. Note that the reduced expansion index obtained targeting Pcna is probably a result of hepatocyte loss (Extended Data Fig. 8).
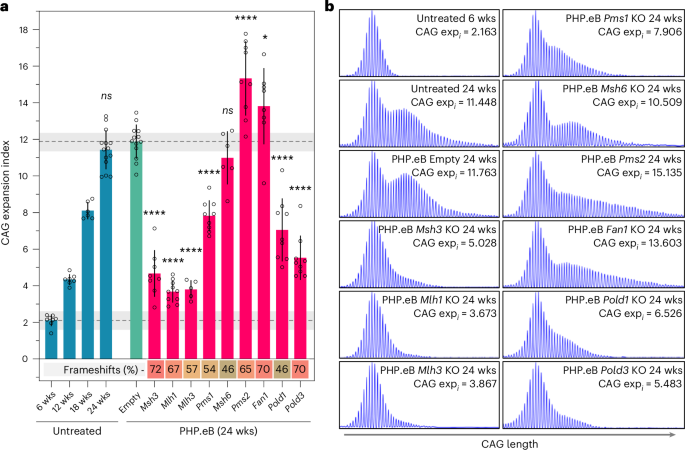
Somatic expansion in the brain is critical for Huntington’s disease onset6,7. Therefore, we tested the impact of targeting a subset of genes on CAG expansion in the striatum, which exhibits high levels of expansion23 and is particularly affected in the human disease24, by systemic delivery of sgRNAs at 6 weeks using PHP.eB, a recombinant AAV9 derivative capable of crossing the blood–brain barrier in C57BL/6 mice25, with readout at 24 weeks (Figs. 1 and 4 and Supplementary Table 6). Modifier effects in the striatum largely recapitulated those in liver, highlighting Pms1 and Pms2, both GWAS onset modifiers, as well as Pold1 and Pold3 as novel expansion modifiers in brain. The weak Msh6 modifier effect at 12 weeks in AAV8-treated liver (Fig. 3 and Supplementary Table 2) was not seen in the 24-week striatum or liver with PHP.eB treatment (Fig. 5, Extended Data Fig. 9 and Supplementary Table 6). Notably, in contrast to the liver (Fig. 3, Extended Data Fig. 9 and Supplementary Table 6), targeting Pms2 in the striatum promoted expansion to a greater extent than Fan1, providing evidence for tissue-dependent effects.
a, Somatic CAG expansion indices, determined from fragment sizing of Htt CAG repeat-containing PCR amplicons of untreated HttQ111 Cas9 mice striata from 6 to 24 weeks of age, and in 24-week-old mice injected at 6 weeks of age with control PHP.eB (empty vector) or PHP.eB expressing sgRNAs targeting genes of interest. *P < 0.05, ****P < 0.0001 relative to empty vector. One-way ANOVA with Dunnett’s multiple comparison correction was used. Bars show mean ± s.d. with overlaid individual data points. Dashed horizontal lines and shaded gray regions show mean and 95% confidence interval expansion indices in 6-week-old untreated mice and in empty vector control-treated mice at 24 weeks of age. The heatmap below shows the percent frameshift mutation (mean) for each targeted gene, with a green–yellow–red (0–100%) color scale. See Supplementary Table 6 for summary statistics, number of animals used (n) and P values. b, Examples of GeneMapper profiles of Htt CAG repeat PCR amplicons.
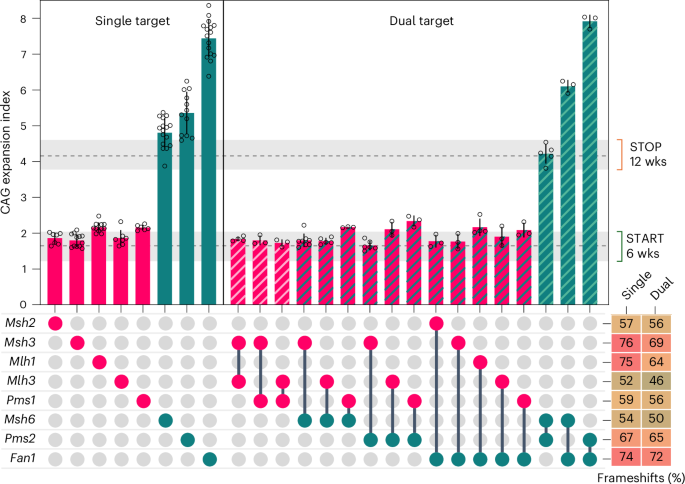
Interactions between pairs of expansion modifiers Msh2, Msh3, Mlh1, Mlh3, Pms1, Msh6, Pms2 and Fan1 were tested by co-injecting two AAV8s, each targeting a different gene. Expansion enhancers are depicted in red and expansion suppressors are depicted in green. Bars show mean ± s.d. with overlaid individual data points of CAG expansion index of HttQ111 Cas9 mice livers at 12 weeks of age following injection with either one (single target) or two (dual target) AAV8s. Dashed horizontal lines and shaded gray regions show mean and 95% confidence interval expansion indices in 6-week-old untreated mice (‘START’) and in empty vector control-treated mice at 12 weeks of age (‘STOP’). The bottom right panel shows the average percent frameshift mutation for each guide when injected in a single or dual gene targeting experiment, with a green–yellow–red (0–100%) color scale. One-way ANOVA with Dunnett’s multiple comparison correction was used. In dual guide targeting with any of the expansion enhancers (Msh2, Msh3, Mlh1, Mlh3, Pms1), expansion indices were not significantly different from those obtained when targeting each enhancer alone (P > 0.999 in all cases). In combinations of expansion enhancers, Fan1 + Pms2 dual guide targeting resulted in an expansion index that was not significantly different from that obtained targeting Fan1 alone (P = 0.8219). By contrast, targeting Fan1 + Msh6 resulted in a significantly lower expansion index than that targeting Fan1 alone (P < 0.0001) and a significantly greater expansion index than that targeting Msh6 alone (P < 0.0001). Targeting Pms2 + Msh6 resulted in a significantly lower expansion index than that targeting Pms2 alone (P < 0.0001) and a slightly greater expansion index than that targeting Msh6 alone (P = 0.0632). It appears, therefore, that the effect of the Pms2 knockout is redundant to that of the Fan1 knockout, and the effects of both Fan1 and Pms2 knockouts are at least partially dependent on the presence of Msh6. See Supplementary Table 7 for summary statistics, number of animals used (n) and P values for all interactions.
We then extended this system to investigate genetic interactions in 12-week liver, as simultaneously targeting two genes with two AAV8s did not appreciably alter editing efficiency compared to that achieved by single gene targeting (Fig. 5 and Supplementary Table 7). We previously reported that Fan1’s expansion suppression was dependent on Mlh1 (ref. 20), an effect recapitulated here by CRISPR targeting Fan1 + Mlh1 (Fig. 5 and Supplementary Table 7). Extending this paradigm to multiple suppressor and enhancer combinations, the effects of suppressors Fan1, Pms2 or Msh6 were fully dependent on enhancers Msh2, Msh3, Mlh1, Pms1 and Mlh3 (Fig. 5 and Supplementary Table 7). In combinations of two suppressors, targeting Fan1 + Pms2 resulted in a phenotype indistinguishable from the Fan1 knockout, while targeting Fan1 + Msh6 or Pms2 + Msh6 reduced the impacts of the respective Fan1 or Pms2 knockouts (Fig. 5 and Supplementary Table 7), indicating complex interactions among the suppressors. We also probed potential functional redundancies that could underlie the lack of effect of single targeting, performing dual targeting for Lig1 + Lig3, Dnmt1 + Dnmt3a and RNaseh1 + RNaseh2a, although none impacted CAG expansion (Extended Data Fig. 10).
Our in vivo HttQ111 CRISPR–Cas9 editing platform thus provides a highly efficient means of screening and identifying novel expansion-modifying genes and their interactions, although it is worth noting that the absence of an effect in this system does not necessarily preclude a role for a particular gene in CAG expansion owing to potential insensitivity to detect modifiers of weak effect (Extended Data Fig. 2), compensatory responses, functional redundancies, cell-type-dependent or age-dependent modifier effects. For example, constitutional Ogg1 knockout has been reported to have an incompletely penetrant effect of suppressing CAG expansion in other Huntington’s disease mouse models26,27. An impact of Ogg1 knockout was not apparent in our system, potentially reflecting a relatively weak effect, lack of sufficient mice to detect an incompletely penetrant phenotype or age-dependent effects of Ogg1 knockout. It is also possible that target mutation heterozygosity might preclude detection of a modifier effect12,13,14. However, given the strong expansion suppression we obtain targeting Msh2 or Mlh3 with ~50–60% frameshift edits in liver and the lack of similar impact in respective heterozygous knockout mice12,13,14, bi-allelic editing appears more likely than monoallelic editing, as supported by a recent study28. Overall, we view this system as an in vivo standardized platform for first-pass testing of candidate genes to prioritize and enable further study.
Importantly, we have identified a number of novel modifiers, including modifiers of CAG expansion in the striatum. We highlight several observations. Firstly, targeting the orthologs of Huntington’s disease onset modifier candidates6,7 (Fig. 3, Supplementary Tables 3 and 4) provides in vivo evidence for PMS1 and PMS2 modifying Huntington’s disease through an impact on HTT CAG expansion. Recent data corroborate the role of Pms1 in CAG expansion in Huntington’s disease mice29. By contrast, TCERG1 and CCDC82 are more likely to modify Huntington’s disease by other mechanisms7,8. Constitutional Rrm2b knockout was previously shown to slightly suppress expansion in liver and striatum20, consistent with the weak (non-statistically significant) effect seen here. LIG1 seems likely to alter Huntington’s disease onset through an effect on repeat instability; therefore, the lack of effect targeting Lig1 here may suggest functional redundancy, consistent with a human LIG1 mutation having a greater impact than a knockout30, highlighting the need to dissect the functional variants from human GWAS. Of all the other genes tested, only POLD1 has subsequently emerged as a genome-wide significant disease modifier in the most recent Huntington’s disease GWAS31.
Secondly, our data do not support an equally important role for all DNA repair pathways in somatic HTT CAG expansion (Fig. 3); rather, members of the MMR pathway, together with FAN1, are clearly highlighted as the key players. The involvement of LIG4, as observed in the liver of a fragile X-related disorders mouse model (CGG repeats)32, suggests a suppressive role for a double-strand break repair process that warrants further study. We also expose roles for transcription and chromatin-related processes, supporting previous observations in different systems (Supplementary Table 4)10 and consistent with the idea that transcription through the repeat and/or an open chromatin structure is important for repeat instability. ERCC1, ERCC3 (XPB) and ERCC5 (XPG) are involved in transcription-coupled repair33, CBP (Crebbp), SETD2 and SETDB1 modify histones34,35,36 and HMGB1, a non-histone chromatin-associated protein, is involved in several DNA repair pathways including MMR37,38,39,40 and binds slipped repeat structures41. HMGB1 promoted CAG expansion in a cell-free system42, in contrast to its suppressor role identified here, implying a different mechanism in vivo. SETD2 recruits MutSα (MSH2–MSH6) to chromatin43; however, the opposing directions of effects targeting Setd2 and Msh6 do not obviously support such a role in vivo. CBP, SETD2 and SETDB1 may alternatively act by post-translational modification of DNA repair proteins themselves44,45.
Thirdly, our data indicate non-redundant functions of MutLβ (MLH1–PMS1) and MutLγ (MLH1–MLH3) that may be distinguished by MLH3’s endonuclease activity, which is critical for expansion15,46, and a possible chromatin structural role of PMS1 that lacks endonuclease activity47. Interestingly in this regard, PMS1 possesses a high-mobility group box48. By contrast, Pms2 suppresses expansion, indicating a distinct role for MutLα (MLH1–PMS2). Notably, Pms1 enhanced HTT CAG and fragile X GGC expansion in cell-based models49,50,51, whereas Pms2 variably enhanced or suppressed expansion in cell or mouse models of fragile X, myotonic dystrophy and Friedreich ataxia50,51,52,53,54. Therefore, the precise roles of MutL proteins appear dependent on the disease-associated repeat context and/or cell type, with important therapeutic implications.
Finally, we have uncovered a role of DNA polymerase delta (POLδ) in promoting CAG expansion. This is strongly supported by the finding that independently targeting all four subunits suppresses expansion. POLδ is known to be involved in gap-filling synthesis in MMR, and its strand-displacement activity has further been implicated in EXO1-independent MMR55,56,57,58. Although we cannot rule out a role for exonuclease 1 in repeat expansion, the absence of any obvious impact of targeting Exo1 in liver raises the possibility that POLδ’s strand-displacement synthesis, which is dependent on both POLD1 and POLD3 subunits, may be important in CAG expansion59,60,61,62. We also identify minor roles for POLβ, previously implicated in repeat instability and proposed to interact with MSH3 in base-excision repair63,64,65, and POLε, which can act in MMR in vitro66, but our data do not obviously support a noncanonical form of MMR that is dependent on POLη (Polh)67.
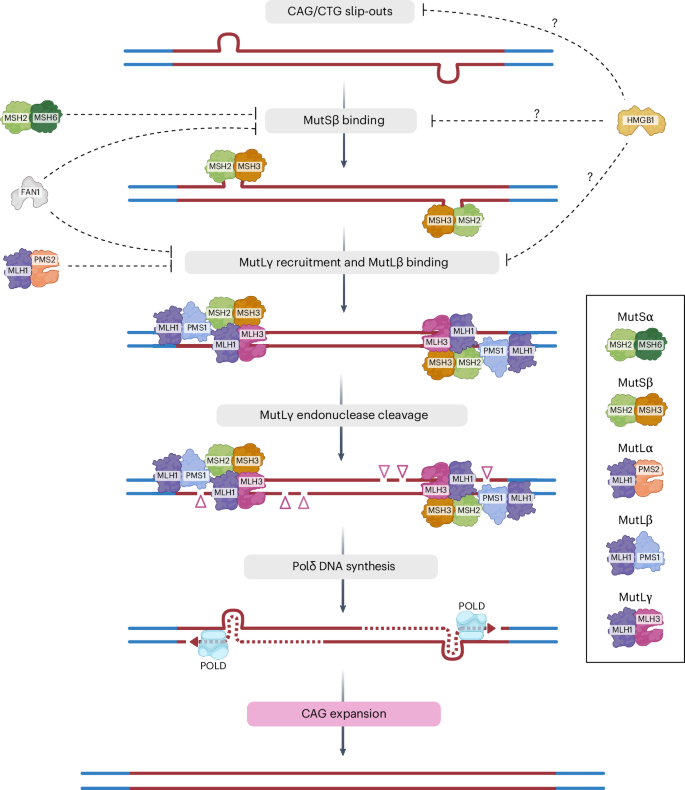
We propose a model (Fig. 6) that incorporates the strongest modifiers, integrating and extending existing observations. The model is centered on the idea that a predominant MutSβ (MSH2–MSH3)-dependent and MutLγ (MLH1–MLH3)-dependent mechanism underlies the somatic expansion bias of the repeat mutation as consequences of (1) the preferential binding of MutSβ to CAG/CTG loop-outs68,69,70, (2) the preferential recruitment of MutLγ to MutSβ-bound DNA46,71,72 and (3) MutLγ endonucleolytic activity, which is critical for expansion15 and which is biased towards the strand opposite the loop-out, thus permitting the incorporation of the additional DNA15,46. Although PMS1 and POLδ promote this pathway, other factors (PMS2, MSH6, FAN1, HMGB1 and others) suppress it, either directly or indirectly; for example, processing of loop-outs by MutLα, whose exonuclease activity directed to either strand does not favor expansions46,52,70, or actions of FAN1 binding to loop-outs or to MLH1 (refs. 73,74). This model predicts that the likelihood of an expansion will depend on the chance of a CAG/CTG loop-out being processed by this expansion-promoting pathway, which will in turn depend on the relative levels of the various protein components and their complexes in cells. This may, in part, underlie cell type differences in repeat expansion9,12,18,75,76,77,78 as well as the sensitivity with which human Huntington’s disease modifier variants capture different disease phenotypes31.
The model depicts the principal pathway driving repeat expansion, with main expansion enhancers shown. CAG/CTG loop-outs are generated, for example in the process of transcription, chromatin remodeling or breathing, and are preferentially recognized by MutSβ (MSH2–MSH3), which preferentially recruits MutLγ (MLH1–MLH3)46,68,69,70,71,72. The role of PMS1 is unclear, but it may have a facilitating role as part of the MutLβ (MLH1–PMS1) dimer at the level of chromatin structure, potentially stabilizing MutSβ or the subsequent MutSβ–MutLγ complex. MutLγ cleaves the DNA strand opposite the loop-out, driving an expansion bias15,46. Strand-displacement synthesis by POLδ results in gap-filling that includes the looped-out DNA. Exonuclease-dependent strand excision cannot be ruled out, and minor roles for DNA POLε and POLβ are also implicated (Fig. 3). DNA ligase seals the resulting nick, and if the loop-outs on each strand are both processed independently52, the length of the loop-out will be incorporated as an expansion. Expansion suppressors such as FAN1 PMS2, MSH6 and HMGB1 may interfere at various steps in this pathway. MutSα (MSH2–PMS6) may decrease MutSβ complex formation and/or binding to loop-outs. MutLα (MLH1–PMS2) to loop-outs bound by MutSβ results in endonucleolytic cleavage on either strand, with no expansion bias46,70. FAN1 may inhibit MutSβ binding by its direct binding to loop-outs74 or may inhibit MutLγ recruitment by sequestering MLH1 (ref. 73). The suppressive function of HMGB1 is unclear but could potentially act at several steps. Other factors (Fig. 3) may also have roles in enhancing or suppressing this pathway. Thus, the likelihood of an expansion event will depend on the steady-state levels of the different expansion enhancer and suppressor proteins or complexes, which are likely to differ by cell type. Genetic interactions (Fig. 5) indicate that PMS2 is redundant to FAN1 in its expansion-suppressing function in liver. The reduced impacts of the Fan1 and Pms2 knockouts in the absence of Msh6 (Fig. 5) are not readily explained, and we speculate that this may implicate a direct role for MSH6 and the existence of an MSH6-dependent factor that enhances FAN1 and PMS2’s expansion-suppressing effect. The model is based on an assumption that MSH and MLH subunits function as part of canonical heterodimeric complexes; however, there is evidence for functions of PMS2 and MLH3 that are independent of MLH1 (summarized in a previous publication80), and similarly, noncanonical roles for MMR subunits may also be plausible in mechanisms underlying CAG instability. Dark red lines represent repeat sequence; blue lines are flanking non-repeat sequence. Triangles mark endonuclease cleavage.
In summary, we have developed a CRISPR–Cas9-based screening approach, providing a paradigm for in vivo genetic modifier studies of other repeat expansion disorders that represent a growing class of currently intractable human diseases. This has allowed us to systematically test a large number of genes, under standardized conditions in vivo, for their role in CAG expansion and represents an in vivo method of analyzing modifiers of repeat instability in any disease at scale. Our results emphasize the importance of studying repeat instability in mice tissues, where modifiers may act differently from other model systems. We have demonstrated high efficiency of genome editing following systemic PHP.eB delivery of sgRNAs to the brain, with relevance to understanding the molecular underpinnings of neurological and neurodegenerative diseases more broadly. We highlight the power of our CRISPR editing platform for the functional validation of modifier genes identified in human GWAS and for uncovering genetic interactions between modifiers. Our genetic interaction data make predictions that can be further tested in humans in the context of genetic interactions between modifier variants. Significantly, we have identified novel modifiers of somatic HTT CAG expansion, the key driver of the rate of Huntington’s disease clinical onset, and provided new insight into underlying pathways that can be dissected by further genetic and biochemical studies. Our data reinforce and extend the pool of potential therapeutic targets to slow somatic expansion, which must also be weighed against their broader safety and druggability profiles79. We highlight MSH3, MLH3, PMS1 and POLδ as potential targets for reducing expression or activity, and suggest FAN1, PMS2 and HMGB1 as possible targets for promoting expression or activity.








Leave a Reply